[TensorRT] Execution Context VRAM 급증 진단과 메모리 할당 전략
worker와 execution context를 늘릴 때 VRAM이 급증하는 원인을 측정하고 동시성에 맞는 메모리 할당 전략을 선택하는 절차입니다.
앞선 CUDA stream 동기화 글은 worker마다 execution context와 buffer를 분리해야 race를 막을 수 있다고 설명했습니다. 또한 데이터 의존 출력 버퍼 글은 output 크기의 상한과 재할당을 다뤘습니다. 두 글의 한계는 context 수를 늘릴 때 중간 activation·scratch·persistent memory가 얼마나 반복되는지, 그리고 동시 실행하지 않는 context끼리 enqueue memory를 어떻게 안전하게 공유할지 다루지 않았다는 점입니다. worker를 늘린 직후 OOM이 난다면 지금 이 다음 단계가 필요합니다.
대상 환경과 실패 증상
Linux 또는 Windows의 NVIDIA dGPU에서 TensorRT 11.4 계열, dynamic shape engine, enqueueV3() 또는 execute_async_v3()를 사용한다고 가정합니다. context 하나는 정상인데 worker를 2~4개로 늘리면 engine을 다시 읽지 않았어도 VRAM이 크게 증가하거나 context 생성·첫 추론에서 OOM이 발생하는 상황입니다. 목표는 무조건 context 수를 줄이는 것이 아니라 동시성 요구와 메모리 상한을 함께 만족하는 것입니다.
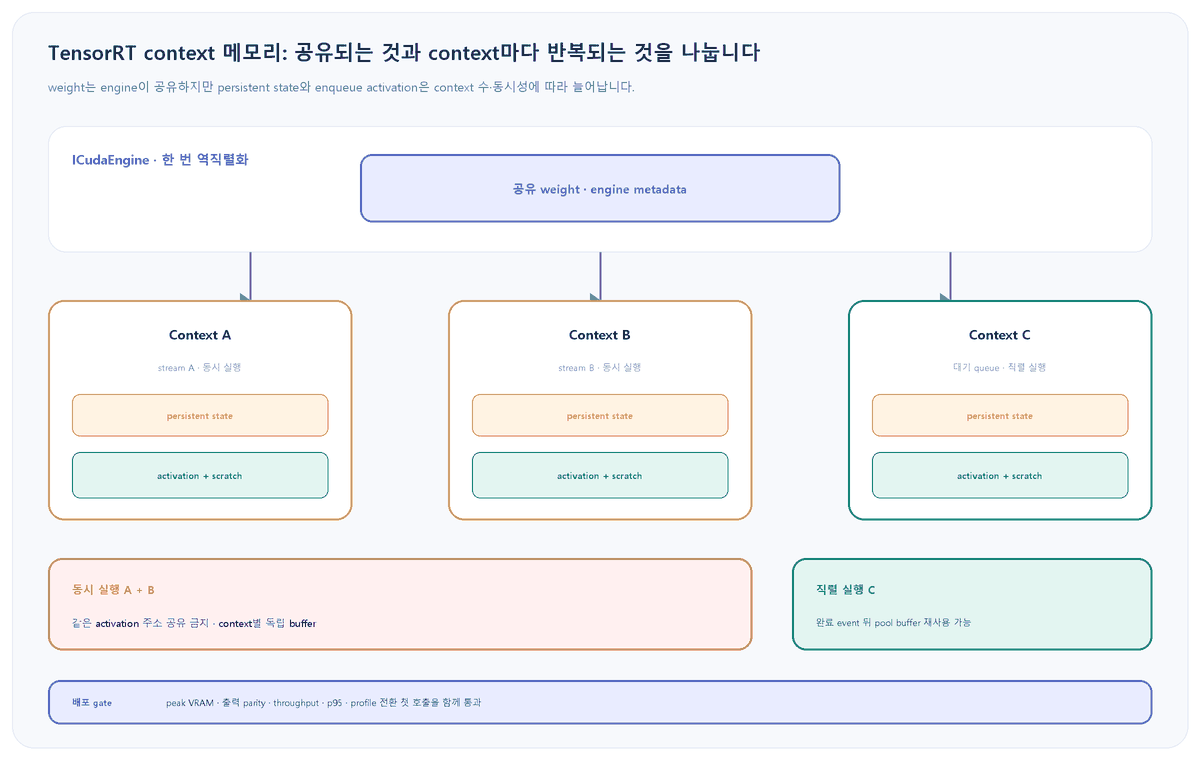
1. 먼저 weight와 context memory를 따로 셉니다
engine을 역직렬화하면 weight가 device memory에 올라갑니다. 각 execution context는 layer 상태용 persistent memory와 추론 중간값·임시 작업 공간을 담는 enqueue memory를 추가로 사용합니다. 따라서 plan 파일 크기만 보고 worker 수를 곱하면 실제 VRAM을 예측할 수 없습니다.
python3 -c "import tensorrt as trt; print(trt.__version__)"
trtexec --help | grep -E 'allocationStrategy|runtimeActivationResize|infStreams'
nvidia-smi --query-gpu=name,uuid,driver_version,memory.total,memory.used --format=csv
기대 관찰값: 실제 설치가 TensorRT 11.x인지, CLI가 세 allocation 전략과 runtime resize preview를 지원하는지, 다른 process가 이미 VRAM을 쓰고 있는지 확인됩니다. pip wheel만 설치한 환경에는 trtexec가 없을 수 있으므로 Python API 경로를 사용합니다.
trtexec --monitorMemory는 build phase의 host·device 사용량을 보는 flag입니다. 이미 만든 plan의 runtime context 메모리 상한으로 오해하지 않습니다.
engine이 보고하는 상한을 기록합니다
import tensorrt as trt

logger = trt.Logger(trt.Logger.INFO)
runtime = trt.Runtime(logger)
with open("model.plan", "rb") as file:
    engine = runtime.deserialize_cuda_engine(file.read())
if engine is None:
    raise RuntimeError("engine deserialization failed")

print("all_profiles_bytes=", engine.device_memory_size_v2)
for profile_index in range(engine.num_optimization_profiles):
    size = engine.get_device_memory_size_for_profile_v2(profile_index)
    print(f"profile={profile_index} bytes={size}")
해석: device_memory_size_v2는 execution context의 enqueue memory 상한입니다. 실제 process 증가는 CUDA context·TensorRT device code·context persistent memory·plugin 내부 할당까지 포함하므로 이 값과 정확히 같지 않습니다. 여러 process가 같은 GPU에서 동시에 변하면 cudaMemGetInfo와 nvidia-smi 차이는 즉시 낡을 수 있습니다.
2. context 수와 allocation 전략을 한 축씩 비교합니다
같은 plan·shape·input·GPU에서 먼저 한 stream과 네 stream을 비교합니다. 그다음 allocation 전략만 바꿉니다. TensorRT 11.4의 static은 모든 profile과 shape의 최대 크기를 context마다 미리 잡고, profile은 선택한 profile에 맞춰 재할당합니다. runtime은 실제 shape에 필요한 양을 목표로 하며 현재 preview resize 기능을 함께 켭니다.
# 기준선: context/stream 하나
trtexec --loadEngine=model.plan --shapes=images:1x3x640x640 --allocationStrategy=static --infStreams=1 --warmUp=1000 --duration=30

# 동시 실행 4개: context별 최대 activation 상한이 반복될 수 있다
trtexec --loadEngine=model.plan --shapes=images:1x3x640x640 --allocationStrategy=static --infStreams=4 --warmUp=1000 --duration=30

# 같은 shape에서 profile·runtime 전략을 각각 비교한다
trtexec --loadEngine=model.plan --shapes=images:1x3x640x640 --allocationStrategy=profile --infStreams=4 --warmUp=1000 --duration=30
trtexec --loadEngine=model.plan --shapes=images:1x3x640x640 --allocationStrategy=runtime --preview=+runtimeActivationResize --infStreams=4 --warmUp=1000 --duration=30
기대 관찰값: context 수가 늘 때 VRAM 증가량과 throughput 증가량을 함께 볼 수 있습니다. runtime 전략이 메모리를 줄여도 첫 shape에서 재계산·할당 비용 때문에 p95가 나빠질 수 있습니다. profile 전환이나 shape 변경 뒤 첫 enqueueV3()는 resource recompute 때문에 후속 호출보다 느릴 수 있으므로 별도로 기록합니다.
| 관찰 | 해석 | 다음 조치 |
|---|---|---|
| 1→4 stream에서 VRAM만 거의 4배 | context별 enqueue 상한 반복 | profile/runtime 전략 또는 동시성 축소 |
| 메모리는 감소, profile 전환 p95 증가 | 재할당·resource recompute | profile별 고정 context와 off-path warm-up |
| TensorRT 상한보다 실제 증가가 큼 | persistent·CUDA·plugin·타 라이브러리 | INFO log·allocator telemetry·process 격리 |
3. 동시 실행하지 않는 context만 USER_MANAGED buffer를 공유합니다
서비스 스케줄러가 context A와 B를 절대로 겹쳐 실행하지 않는다면 application이 enqueue memory를 소유하고 하나의 buffer를 번갈아 줄 수 있습니다. TensorRT 11.x에서는 createExecutionContextWithoutDeviceMemory()가 제거됐습니다. kUSER_MANAGED와 V2 API를 사용합니다.
auto context = std::unique_ptr<nvinfer1::IExecutionContext>(
    engine->createExecutionContext(
        nvinfer1::ExecutionContextAllocationStrategy::kUSER_MANAGED));
if (!context) throw std::runtime_error("context creation failed");

if (!context->setInputShape("images", nvinfer1::Dims4{1, 3, 640, 640}))
    throw std::runtime_error("shape rejected");

size_t required = context->updateDeviceMemorySizeForShapes();
if (required == 0) throw std::runtime_error("activation sizing failed");

void* activation = nullptr;
if (cudaMalloc(&activation, required) != cudaSuccess)
    throw std::runtime_error("activation allocation failed");
context->setDeviceMemoryV2(activation, static_cast<int64_t>(required));
순서가 중요합니다: 사용할 optimization profile과 모든 dynamic input shape를 먼저 지정하고, 부족한 shape tensor가 없는지 확인한 다음 크기를 계산합니다. shape나 profile을 바꾸면 context가 idle인 동안 다시 계산하고 buffer 크기를 검증합니다. 위 코드는 핵심 순서만 보인 예시이므로 실제 구현에서는 context보다 activation buffer가 오래 살도록 소유권을 묶고, 모든 GPU 작업 완료 뒤 cudaFree를 호출합니다.
공유 가능한 조건과 금지 조건
- 공유 가능: scheduler lock 또는 완료 event로 이전
enqueueV3()의 network execution 완료를 확인한 뒤 다음 context에 같은 buffer를 할당합니다. - 공유 금지: 서로 다른 stream에서 두 context가 동시에 실행될 수 있다면 각각 독립된 activation buffer가 필요합니다. 같은 주소를 병렬 context에 주면 undefined behavior입니다.
- CUDA Graph 주의: user-managed activation 주소와 I/O 주소는 graph capture 상태에 포함됩니다. graph별 context를 유지하고, capture 후 주소를 임의로 바꾸지 않습니다.
- persistent memory: enqueue buffer를 공유해도 context 생성 시 필요한 layer persistent state까지 사라지는 것은 아닙니다. context 수에 따른 잔여 증가분을 별도로 측정합니다.
4. 운영 상한은 context 수가 아니라 동시 실행 수로 계산합니다
대기 context가 많아도 실제로 겹쳐 실행하는 수가 작다면 activation pool을 그 동시성에 맞출 수 있습니다. 반대로 worker thread 수와 동시 GPU 실행 수를 같은 값으로 놓으면 context·buffer·stream이 과도하게 늘 수 있습니다.
budget = engine_weights
       + context_count * persistent_per_context
       + max_concurrent_enqueues * activation_buffer_bytes
       + io_buffers + cuda_and_plugin_headroom

admit_new_request = measured_free_bytes >= request_bytes + safety_margin
이 식은 설계용 분해이지 고정 수치가 아닙니다. INFO log, engine API, 실제 allocation telemetry를 결합해 값을 채웁니다. custom IGpuAllocator로 TensorRT allocation을 추적할 수 있지만 plugin 내부나 CUDA stream buffer처럼 포착되지 않는 경로가 있으므로 process 전체 VRAM과 함께 봅니다.
이 초안의 검증 경계
NVIDIA TensorRT 11.4.1의 runtime memory, allocation strategy, execution context, migration, benchmarking 문서와 CUDA memory API를 대조했습니다. Python 예시는 구문 검사 대상으로 구성했습니다. 이 Windows 작성 환경에는 연결된 TensorRT GPU 서버가 없어 실제 plan의 context별 persistent·activation 증가량, allocation 전략별 p95, USER_MANAGED 동시성, 출력 parity를 실행하지 않았습니다. 대상 GPU에서 같은 plan·shape·input으로 반드시 측정해야 합니다.
롤백과 배포 기준
- context 1개와 기존 STATIC 전략을 기준선으로 보존하고, context 수·allocation 전략·shape 중 한 축만 바꿉니다.
- USER_MANAGED buffer를 공유한 뒤 출력 parity가 깨지거나 race detector·timeline에서 실행 겹침이 보이면 즉시 context별 독립 buffer로 되돌립니다.
- profile/runtime 전략이 peak VRAM을 줄여도 첫 요청 또는 profile 전환 p95가 SLO를 넘으면 profile별 고정 context와 off-path warm-up으로 돌아갑니다.
- 예상 상한보다 실제 VRAM이 계속 크면 plugin·CUDA·PyTorch allocation을 포함한 process 전체 추적 전까지 worker를 추가하지 않습니다.
- 메모리 절감이 throughput·p95·출력 정확성과 함께 통과하지 않으면 배포하지 않습니다.
공식 출처
- NVIDIA TensorRT 11.4.1: runtime memory, persistent·enqueue memory, production bounding
- NVIDIA TensorRT Performance Benchmarking: allocationStrategy와 runtimeActivationResize
- NVIDIA ICudaEngine Python API: device memory size와 profile별 상한
- NVIDIA IExecutionContext Python API: shape별 size 갱신과 memory lifetime
- NVIDIA TensorRT 11 C++ Migration: getDeviceMemorySizeV2와 setDeviceMemoryV2
- NVIDIA TensorRT Performance Optimization: CUDA Graph와 user-managed memory 주소 계약
- NVIDIA CUDA Runtime API: cudaMemGetInfo, cudaMalloc, cudaFree
- NVIDIA Triton TensorRT Backend: STATIC과 ON_PROFILE_CHANGE 운영 설정